As an email sender, there’s a lot to think about. There are insights about deliverability you want and need to know. Google Postmaster Tools can be an awesome resource for people looking to optimize email without getting too in the weeds. To help you get started, we put together this quick guide to Google Postmaster Tools. According to Gmail, using these tools can determine the health of your email program. Follow these steps to add a domain you’d like to monitor.
First, obviously, you’ll need to log in to https://postmaster.google.com with your G Suite or Gmail address. If you’d like your entire marketing team to have access to these insights, it is a good idea to make a net new Gmail address to be shared by all users, rather than sharing your personal login information (bad idea).
Click the button that looks like a red plus in the bottom right corner. This is the step you’ll need to repeat to add each domain.
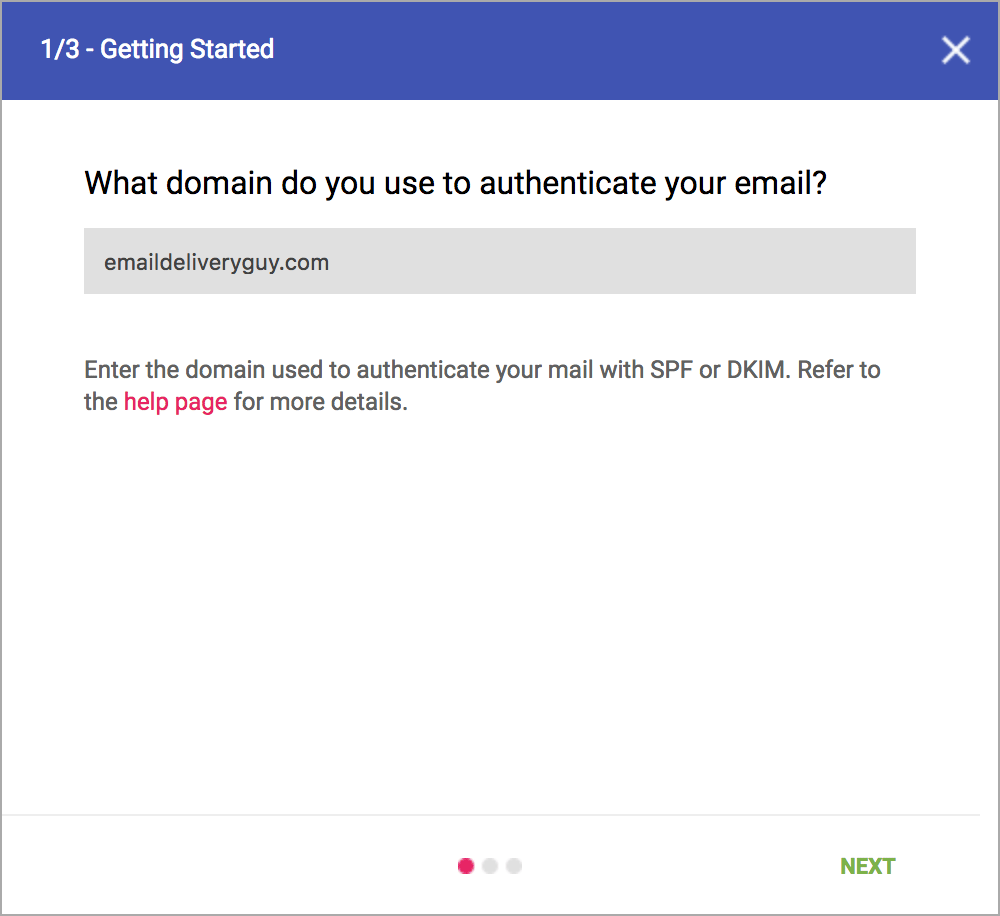
Enter your domain name:
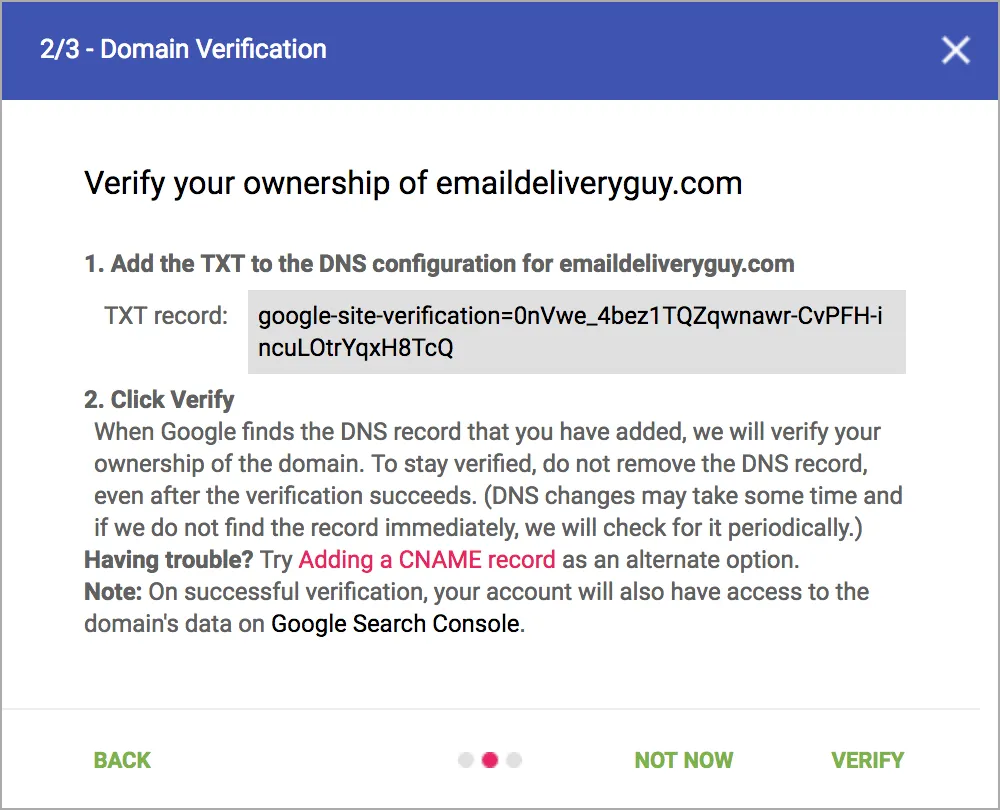
Take the TXT record to your DNS provider:
Now you’ll need to open a new tab or browser window to go to your DNS provider and create the proper TXT record. (NOTE: You can also click “not now” at this point and come back to verify the domain if it takes time to add the TXT verification record. There’s no need to leave this box open, but you can.)
Select “Verify” to complete the setup.
Once you successfully complete the setup of your TXT records, you will be able to see additional information about your domain(s), including things like encrypted traffic, authenticated traffic, spam feedback loop, domain reputation, IP reputation, user complaints, and delivery errors. Once you verify your root domain via the DNS TXT records, you can add any subdomain without having to add additional records and share access to the data with your delivery consultant or Email Service Provider.
Now that you’re in, you have a whole new world of data at your fingertips.
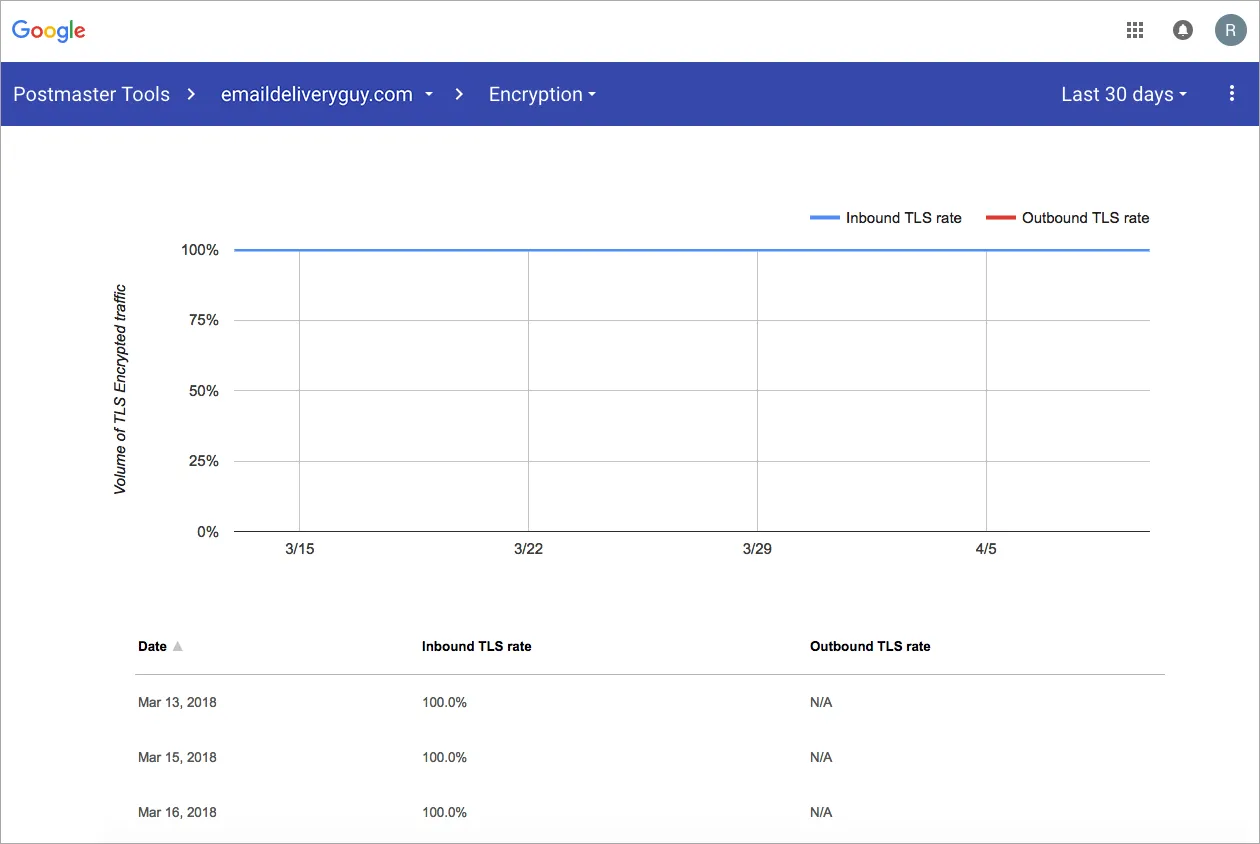
Gmail is one of the largest supporters of sending encrypted emails between networks, using Transport Layer Security (TLS). Google even publishes a live graph showing inbound and outbound traffic to their networks using TLS as part of their Transparency Report. Reference this report to find where you stand and where you can make improvements in your overall sending practices.
Another benefit of sending email via an encrypted communication channel is a green “locked” icon appearing on the Gmail web interface, or a red “unlocked” icon where it was sent without encryption.
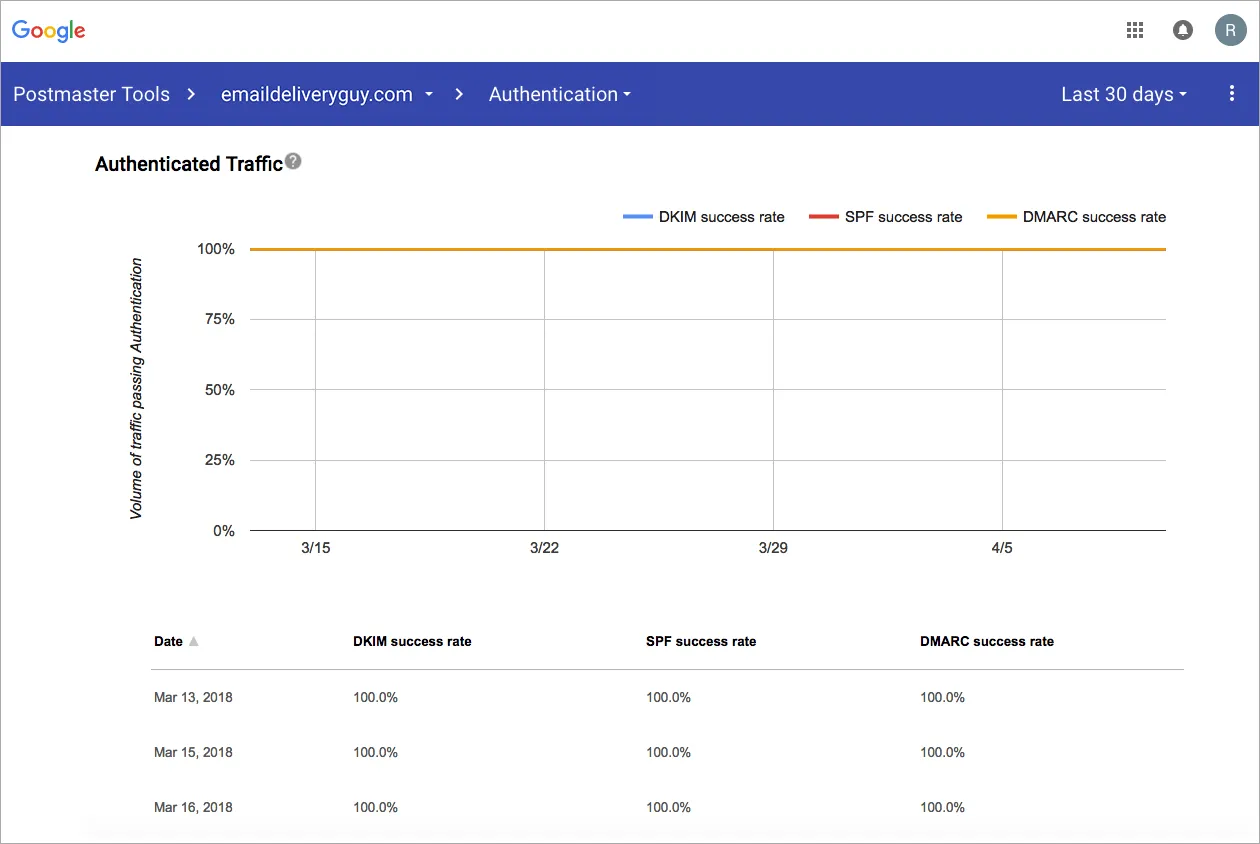
Google also monitors the amount of properly authenticated email sent from your domains. This data allows you to see if you are sending from a network with improper authentication or potentially none at all.
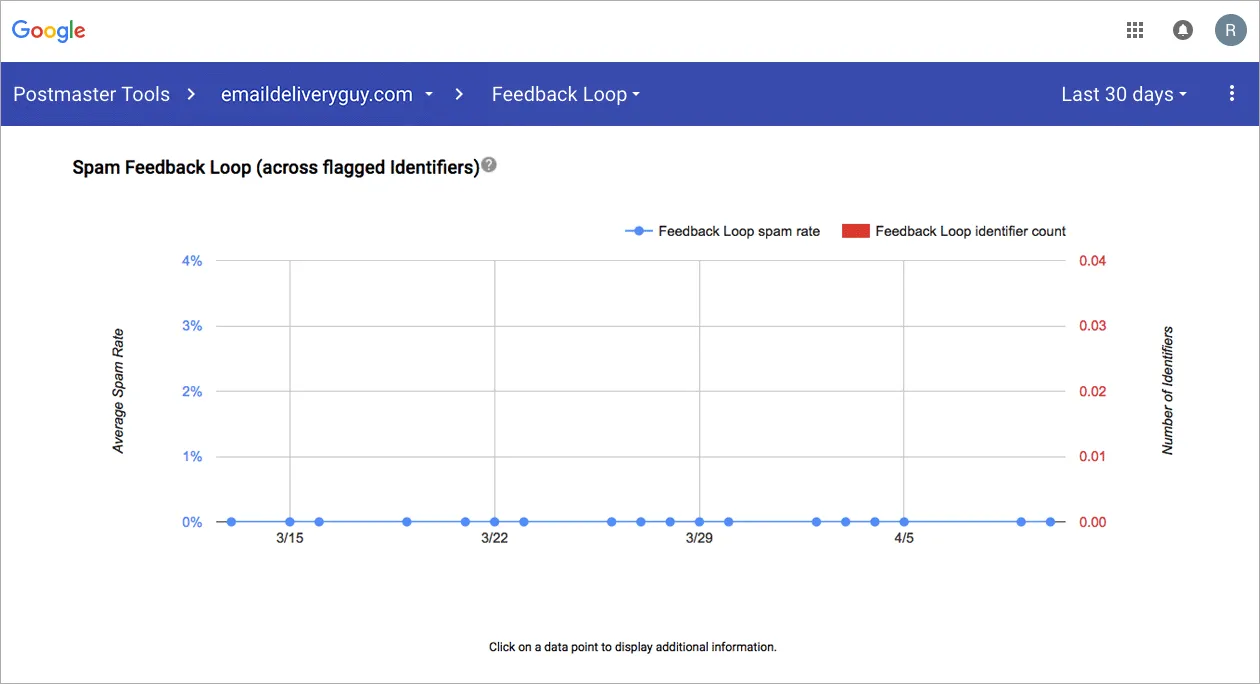
Gmail’s Feedback Loop (FBL) program is different from more traditional programs, as they are concerned about users’ privacy and sharing this data with the sender of the message. FBL reports from Gmail are sent in an aggregate fashion and show trends around campaigns generating complaints from their users. This graph will show you daily trends to help identify problem campaigns. For more information on setting up Google’s Feedback Loop, read their FAQ here.
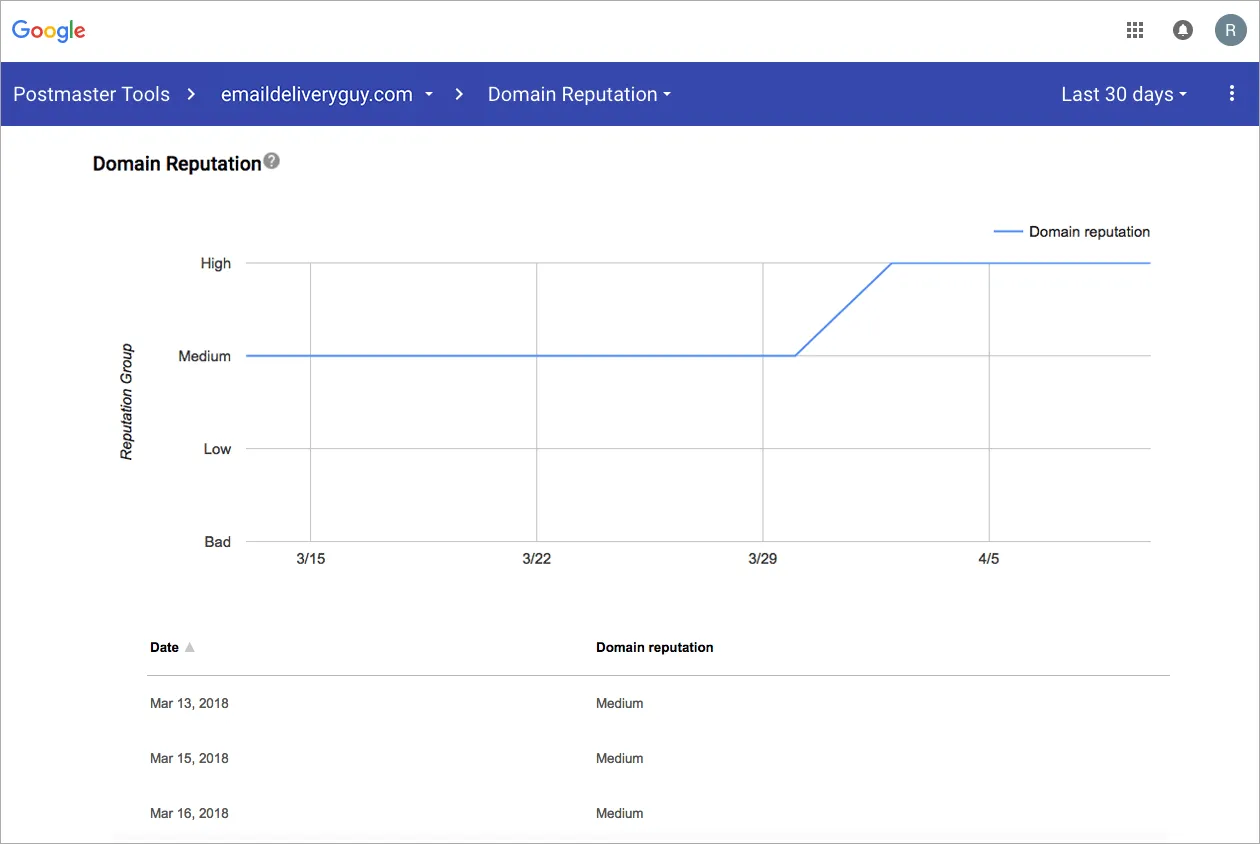
Lots of people talk about IP reputation, and we will later, too, but a growing trend with ISPs is to monitor domain reputation. Gmail is likely the most advanced of all the ISPs currently tracking this. Domains are a lot harder to change as they tend to be closely tied to a brand name. Knowing where you stand can make all the difference between the inbox and the spam folder, or a high and a low domain reputation. This is also important as a high-reputation domain on a shared IP can behave significantly better than a low-reputation domain on that same IP address.
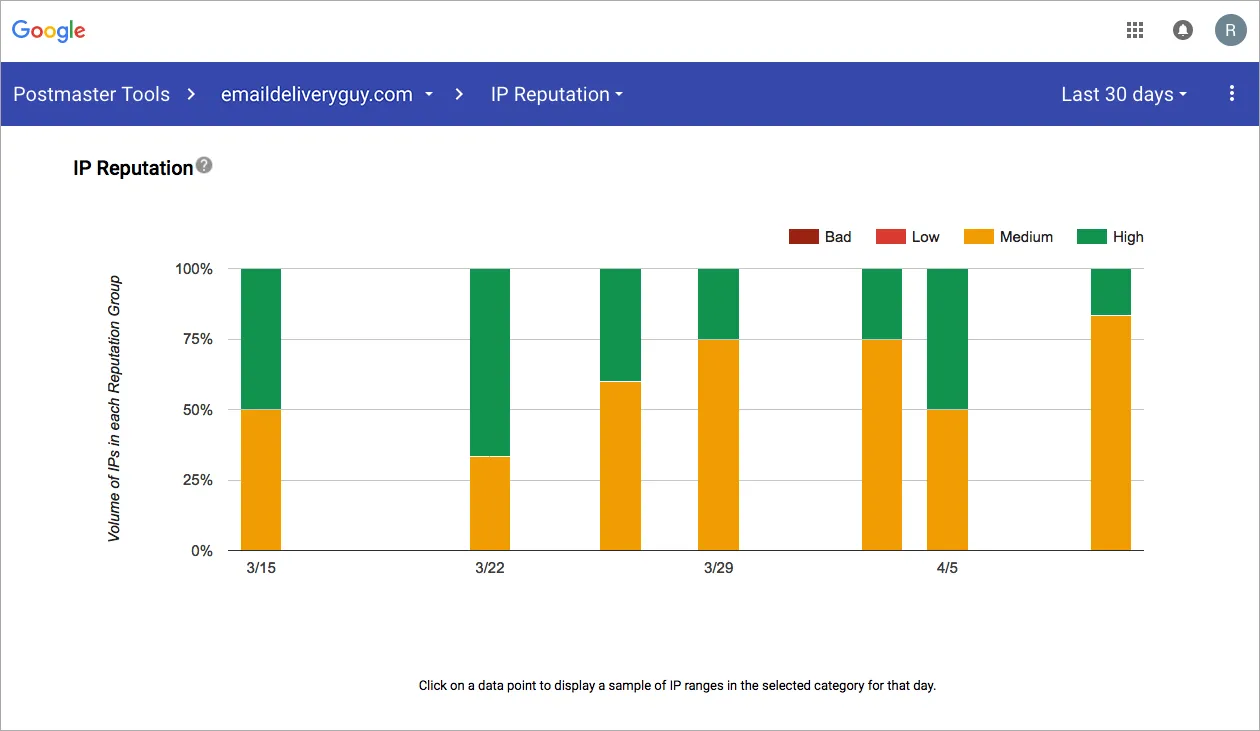
IP Reputation is a well-known measurement for email marketers, and Gmail gives you a lot of perspective on how well your mail is performing in this regard. If your domain is sending from multiple IPs, you’ll see a summary of their behavior by day in an overview illustrating the combined reputation of the IP addresses seen sending mail from your domain. Note that by clicking on any of the colors in a single bar, GPT will then populate which IPs, in this example, are green vs. yellow.
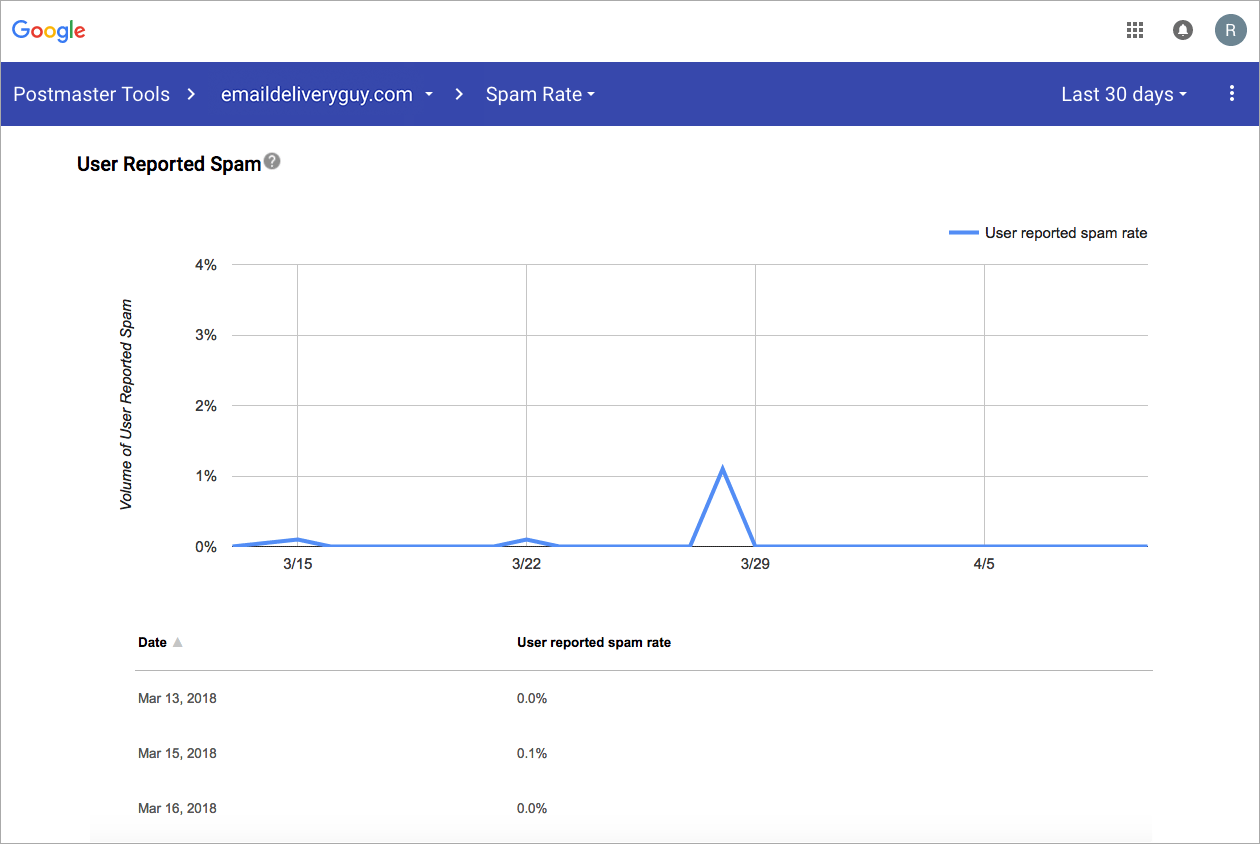
Tied into all the reputation factors (and one of the more heavily weighted contributors) is the user-generated “spam complaint.” On the User Reported Spam dashboard, you’ll find a graph showing your daily complaints across all campaigns. This is something to monitor during times of spam folder delivery.
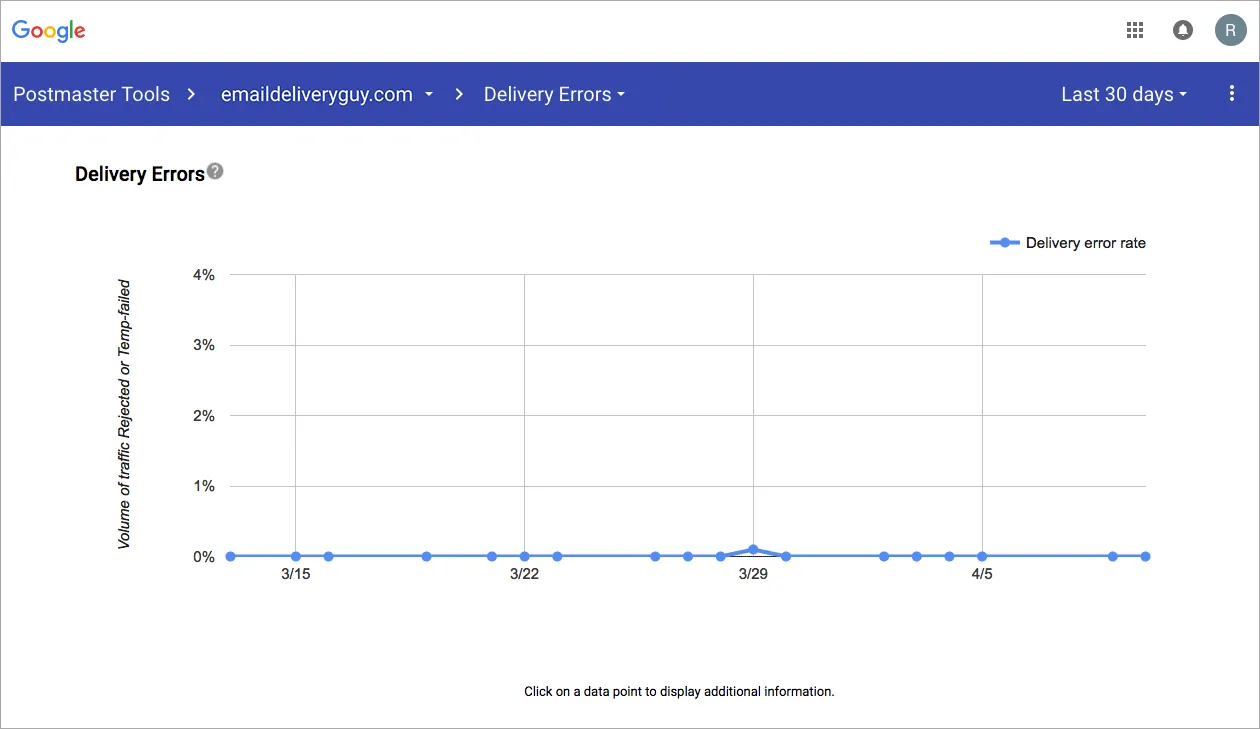
Are you getting too many bounces? This last graph, Delivery Errors, will show you if you are, and the dates they happened. A great delivery rate, or non-bounce rate, sits at around 98% of the mail you send successfully from your email platform to the recipients’ mail servers. Welcome messages and lead generation campaigns tend to be a little higher, but should aim to maintain non-bounce rates in the 93-95% range to help maintain your reputation. Keep an eye on your messages here, and see how you are performing with your Gmail-hosted recipients.
And there you have it. We hope this is a helpful primer for getting your Google Postmaster Tools up and running. If you need more insight into deliverability or find you really need to get your email right, let us know. We can help.
