Email Deliverability
The 2026 DMA Email Benchmark Report: What the Numbers Really Mean for Revenue
minute read

Key Takeaways
- Headline metrics look strong across the board, but "delivered" and "deliverable" are not the same thing, and the gap is where revenue disappears.
- Click rates are being reshaped by AI, not just by subscriber behavior, and the weakest-looking sectors may actually be adapting fastest.
- The old playbook of test-and-learn is giving way to continuous, AI-driven optimization, and marketing leaders need a new set of KPIs to match.
In a channel as competitive as email, “good” is a moving target. This year’s DMA (Data & Marketing Association) UK Email Benchmarking Report, sponsored by Validity, gives us the clearest read yet on where the bar sits and what separates good programs from great ones, taking advantage of the massive revenue uplift this channel can drive.
The report draws on data from six major email service providers, making it the most complete view of UK email performance available today. [You can grab a copy here.]
The headline numbers
Year over year, the report tells a positive story for the channel:
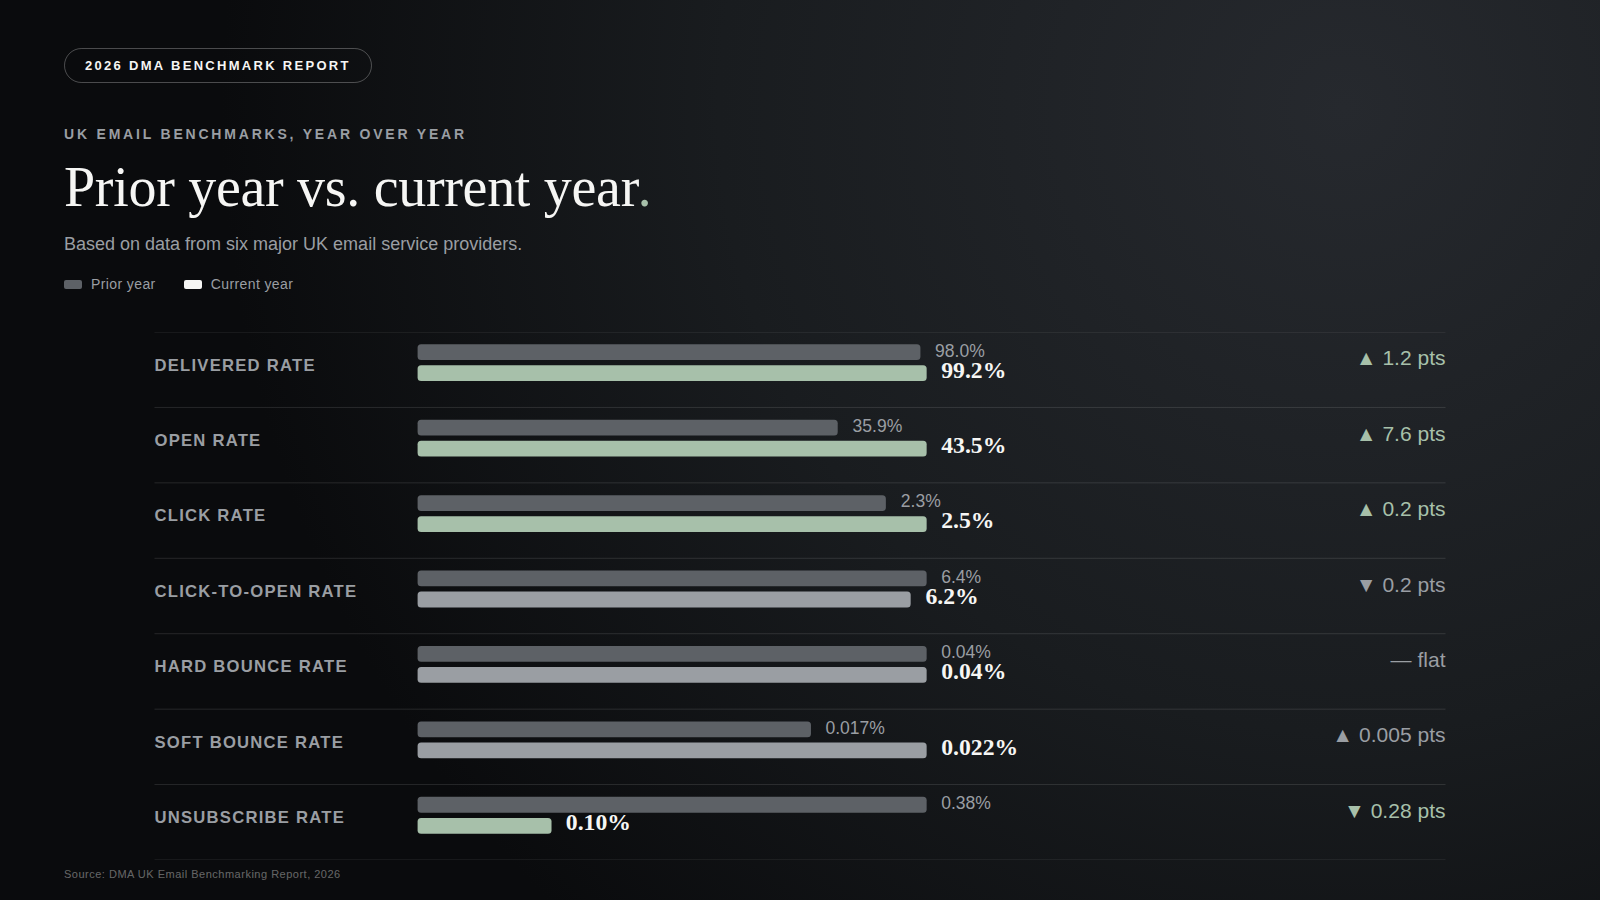
At the sector level, the variance is even more telling. Retail and travel sit at the bottom for clicks (1.0 percent and 1.2 percent respectively). B2B posted the sharpest improvement in delivered rates, climbing from 90.7 percent to 95.6 percent, a clear signal that this segment has sharpened its acquisition and list hygiene practices.
Taken together, these numbers look like good news. For revenue leaders, the more useful question is what’s actually driving them, and where the real opportunity sits.
Delivery is not deliverability
A 99.2 percent delivered rate looks strong, but it doesn’t tell you how many of those emails actually reached the inbox. That’s inbox placement rate (IPR), and it’s the number that determines whether your email investment converts to revenue at all. Globally, IPRs are running at 87 percent this year, meaning roughly one in eight legitimate, permission-based marketing emails never reaches the inbox. UK average IPR sits closer to 91 percent but has declined by more than two points as mailbox providers tighten enforcement of bulk sender requirements, with Microsoft’s roughly 30 percent share of UK inboxes remaining the hardest to place with.
For any marketing leader tracking email ROI, this is the number to watch first. A typical sender averaging 90 percent inbox placement has an immediate, double-digit lift available, before spending another dollar on content or creative.
The click story is more complicated than it looks
Clicks are up only slightly overall, but the more interesting shift is happening underneath the surface. AI-generated email summaries are increasingly surfacing call-to-action links directly in the inbox, before a subscriber ever opens the message. That can drive traffic, but it also means senders are ceding the click decision to an AI’s judgment about which link matters most.
That shift likely explains the weak sector numbers for retail and travel. It’s unlikely these programs actually lost half their click performance year over year. More likely, AI summaries and assistants are activating fewer but higher-intent clicks. The real story isn’t declining performance. It’s an urgent need for better attribution.
The brand billboard effect: what inactive subscribers are still worth
Every email program carries an inactive segment, often as much as 50 percent of the total list. Most senders are reluctant to mail to it, worried about the deliverability hit. But that reluctance overlooks email’s role as a brand billboard in the inbox. Subscribers see the sender name and subject line even when they don’t open or click, and they still respond in other ways: visiting a store, checking a product review, going straight to the website.
When those alternative responses are factored in, inactive subscribers can account for roughly 25 percent of a program’s total revenue, driven largely by brand reputation rather than direct engagement. That’s a meaningful number to bring into any conversation about list suppression strategy or program valuation.
Are opens still a useful metric?
Not as useful as they once were, but not useless either. Zeta Global, a contributor to this year’s report, recently published data showing unique opens of 40 percent against a “true open” rate, with mailbox provider inflation stripped out, of just 11 percent. That means roughly three-quarters of recorded opens may not reflect a real, human open at all.
Validity has seen this firsthand. In Q1, many customers reported significant drops in Gmail open rates, largely explained by changes to Gmail’s image-fetching behavior and inbox updates, not a genuine collapse in engagement. Click rates for the same customers held steady over the same period, confirming that subscribers hadn’t disengaged.
Opens still carry some directional value. They’re useful for relative comparisons, an 80 percent open rate still beats a 60 percent open rate in an A/B test, and for Apple-based traffic specifically, an open is only generated when a message has actually achieved inbox placement. But leaders should stop treating open rate as a standalone success metric.
From testing to continuous optimization
The traditional model of testing one variable at a time is losing relevance. Processing power and AI have made it possible to treat an entire email program as a continuous testing environment, one where improvements are identified and implemented automatically rather than in scheduled test cycles.
What doesn’t go away is measurement. It just needs to focus on different signals:
- Replies. Among the strongest intent signals a subscriber can send, and a factor mailbox providers weigh heavily in inbox placement decisions. Very few programs actively encourage or track them.
- Disaffection. What’s the combined cost of bounces, unsubscribes, and complaints? Are new positive engagements outpacing that attrition, and what does it cost to replace a lost subscriber?
- Trust. Everyone talks about trust between senders and subscribers, but few programs actually measure it, or whether the relationship is balanced in the subscriber’s favor.
These signals support a newer KPI worth putting in front of the rest of the C-suite: Return on Relationship (RoR), which tracks the cumulative impact of opens, clicks, repeat purchases, and retention over time. Unlike last-touch attribution, RoR captures whether a history of email engagement is building enough trust to make the next message worth opening.
The bottom line for email ROI
Three priorities stand out for leaders looking to translate these benchmarks into revenue:
- Know your true inbox placement rate, not just your delivered rate, and close the gap. A typical sender at 90 percent IPR has a straightforward path to a double-digit performance lift.
- Shift more volume into lifecycle messaging. Triggered flows already generate a disproportionate share of revenue relative to send volume, and that gap is widening.
- Get ahead of how AI is reshaping subscriber behavior. Test how your emails summarize, how they surface in AI-powered shopping assistants, and whether your most important content and calls to action are structured to survive that translation. Subscribers are wary of AI and privacy, but convenience tends to win out, and the mailbox providers are moving fast either way.
Programs built to measure the right things (inbox placement, reply signals, relationship strength, not just opens and clicks) are the ones that will show up on next year’s benchmark as the new leaders. Teams using Validity Engage are already building this kind of continuous, AI-assisted optimization into their day-to-day program management, turning these benchmarks into an ongoing practice rather than an annual report card.
Learn more about Validity Engage.